If you want to dive deeper into fantasy baseball, be sure to check out our award-winning slate of Fantasy Baseball Tools as you prepare for your draft this season. From our Cheat Sheet Creator – which allows you to combine rankings from 100+ experts into one cheat sheet – to our Draft Assistant – that optimizes your picks with expert advice – we’ve got you covered this fantasy baseball draft season.
The stickiness of a statistic refers to such a statistic’s ability to stay consistent over time
It is really hard to predict the future, and that has always been true with baseball players. An incredible amount of money and resources goes into evaluating Minor League players to determine which ones will succeed in the Major Leagues, and which ones will not.
I’m no baseball scout. I can’t tell you the first thing about swing mechanics or player development. I can, however, do some stuff with large amounts of numbers that not a lot of people cannot – so that’s what I’m here to do.
The goal was to find which Minor League statistics are most predictive of Major League statistics at the individual player level. If we can find some statistical categories that players usually stay relatively consistent in from their Minor League career to their Major League careers, we might be able to be better at evaluating players in the future. This is especially useful for fantasy baseball purposes when you are trying to identify rookies that can contribute to your fantasy team.
2020 Draft Kit: View printable cheat sheets, sleepers & mistakes to avoid ![]()
My Process
- Retrieve all Minor League hitting stats for the last 10 seasons (2010-2019 for levels A+, AA, and AAA)
- Retrieve all Major League hitting stats for the last five seasons
- Loop through every player that had 200 or more at-bats at the Major League level over the 2015-2019 seasons and compare their Major League statistics with the Minor League statistics
- Find the overall correlation coefficients for each category to give evidence on which categories are the most predictive
None of this was all that hard, although I did have to manually copy and paste all of the Minor League stats into Excel. That took a moderate amount of time, but nothing major. For the MLB stats, I just wrote a quick web scraping script to go get all those stats from Fangraphs.
I further cleaned up and aggregated the data to fit my needs, and then proceeded with the analysis.
The difference between AAA baseball and A+ baseball is pretty substantial, so I decided to run the tests are each level individually, as well as all of the Minor League statistics as a whole.
To fully explain this, let’s just take a quick example using Aaron Judge.
Here are my Aaron Judge rows in my Minor League data:

Adding all those totals up we get this as Judge’s full Minor League record:

And then of course, here are Aaron Judge’s Major League statistics:

I plotted and compared Judge’s statistics at each Minor League level and his cumulative Minor League statistics with his Major League numbers for each of the below categories.
Strikeout Rate
Walk Rate
Batting Average
On-Base Percentage
Slugging Percentage
Plate Appearances Per Home Run
Stolen Base Attempt Rate (singles + walks / steal attempts)
Doing this with one player or even a few dozen players is pretty worthless given how small of a sample size that is, but doing it for every single player that has achieved 200 or more at-bats at the Major League level over the last five seasons is a pretty large sample.
It is important to note that my sample is still a bit biased, since it is not easy to get 200 at-bats at the Major League level. It requires either a high prospect pedigree, and/or a strong Minor League track record, and/or a strong start to a Major League career to reach those numbers. Lots of players since 2015 have unable to hack it in the Majors and have flamed out before getting enough opportunity to be included in this sample. That is something to keep in mind, but it doesn’t hurt us too bad for the purposes of this study.
Now let’s get to the results.
Overall Minor League Stats are Most Predictive
The most meaningful correlations in each category came from the overall minor league numbers as compared to one of the three individual levels. This came as no surprise to me just because the full minor league data is an inherently larger sample, and larger samples will always tell us more truth.
When comparing the individual levels, their significance went in order with AAA being the most predictive and A+ being the least. Again, not a huge surprise since AAA pitching is most of the time closest to the big league level.
Predictive Stats
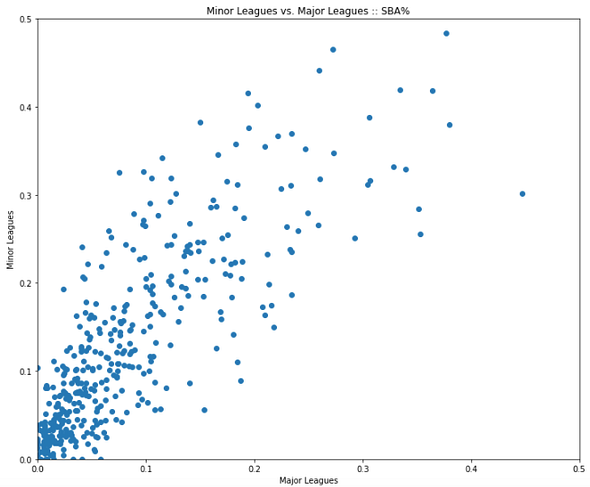
Stolen Base Attempt rate was the winner here, with a correlation coefficient of .81. This is a very strong positive correlation. However, most of that is undoubtedly tied to the fact that players that don’t attempt steals in the Minors at a high rate (the majority of players) also don’t attempt steals in the Majors at a high rate. This should be no surprise to anybody, and the scatter plot shows that the correlation does die down quite a bit after you get past the guys that don’t run at any level.
Strikeout and walk rate are the true winners here, with very strong positive correlates of .77 and .72 respectively.
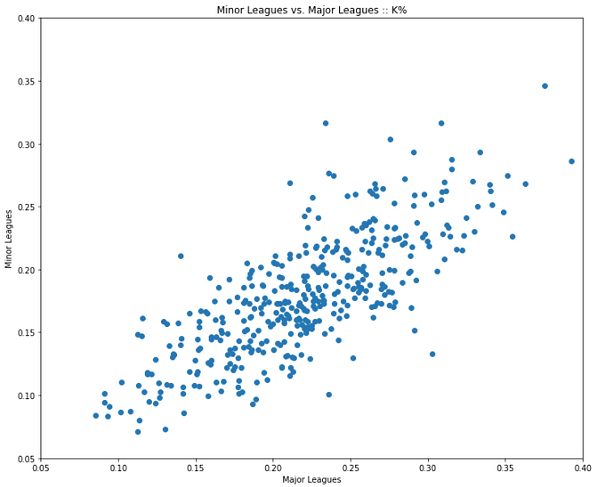
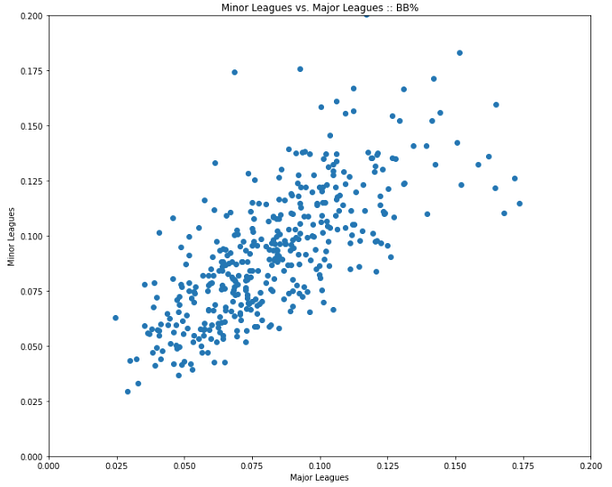
I did expect these two statistics to stand out, but maybe not quite this much. This is enough evidence to feel pretty confident betting on a player to have very similar strikeout and walk rates in the Majors as he did in the Minors.
Since walk rate is so highly predictive, on-base percentage follows along, however to a lesser degree (a .53 correlation coefficient). Most of this correlation is explained by the walk rate, because as we will see – the batting average part of the on-base percentage calculation does not help much.
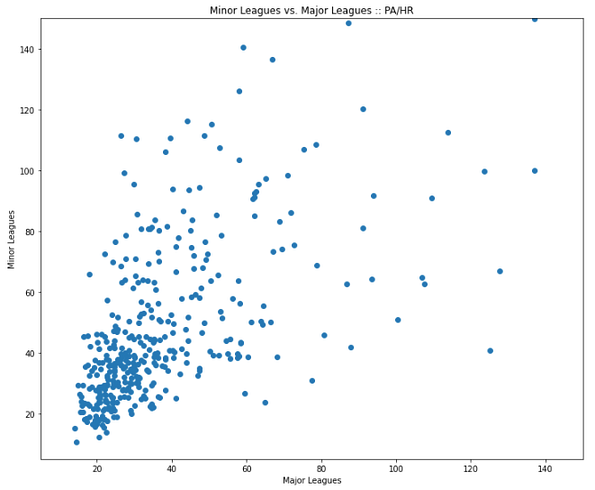
Home run rate was also a sorta-kinda winner, with a .59 correlation coefficient. That number certainly doesn’t make you feel great about putting a bunch of chips on a Minor League home run champ turning out to be a strong Major League power hitter as well, it is well above the “no relationship” line (which I would call .3 or so for these purposes).
Non-Predictive Stats
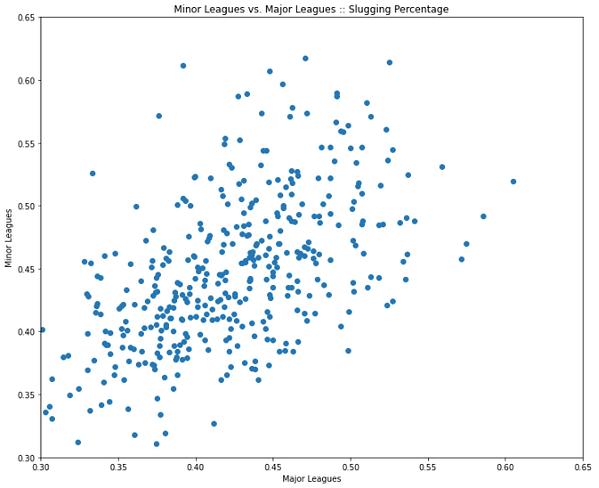
Batting average and slugging percentage. These two aren’t completely non-predictive, but they are random enough to just not even attempt to predict a guy’s Major League numbers based on their Minor League numbers. Batting Average came in with a .42 correlation coefficient while Slugging Percentage was the overall loser of this study with a .37.

What Do We Learn?
Firstly, we should always value the total minor league statistics over the individual level statistics. Sample size will always reign as most important – do not forget that. If you have to choose a level to prefer: the higher, the better.
Secondly, plate discipline is clearly very sticky. If you strike out or walk a lot in the minors, you will probably continue to do so in the Majors – and vice versa. If a player is torching Minor League pitching but racking up strikeout rates in the upper-20’s for his Minor League career, it’s pretty safe to assume he will be a high strikeout hitter in the Majors, which will make it that much tougher for him to have a successful Major League career.
If you are trying to predict a Minor League player’s future, focus on the plate discipline – those are by far the best predictors.
If you would like to see any of the data I collected or learn more about my process, you can contact me on Twitter! Thanks for reading!
Practice fast mock drafts with our fantasy baseball software ![]()
Subscribe: Apple Podcasts | Google Play | SoundCloud | Stitcher | TuneIn
