Every batted ball in a baseball game is hit with a certain velocity, and Major League Baseball has been tracking all of those velocities for all games since the 2015 season. We now have the ability to go see exactly how hard a hitter has hit every ball he has put into fair territory, which is useful for fantasy players.
The average exit velocity for a batted ball in 2019 was 84 miles per hour, the exit velocity for home runs in 2019 was 104 miles per hour, and the hardest ball hit in 2019 was 120 miles per hour (Giancarlo Stanton).
This statistic is self-explanatory, there is not much to dive into in terms of what it is. A harder hit ball is more likely to go for a hit, this is true for all batted ball types. A harder hit ground ball will get through the infield faster, making it less likely an infielder is able to get in front of it. A harder hit fly ball will travel further, making it more likely that the ball will go for extra bases. These are simple logical observations. However, there are important things to note when using this stat for fantasy baseball purposes.
Practice fast mock drafts with our fantasy baseball software ![]()
Firstly, you have to consider strikeouts as well. When a hitter strikes out, there is no exit velocity there to affect his average. That leads to the hardest swingers finding their way to the top of the leader boards in this stat. The top five in average exit velocity in 2019 were Aaron Judge (95.9), Miguel Sano (94.4), Nelson Cruz (93.7), Franmil Reyes (93.3), and Christian Yelich (93.1). Four of those guys (excluding Yelich) are very similar profiles: monstrous humans that hit a lot of home runs but also strike out at a high rate. If you fail to account for strikeouts, you would probably think that these guys are hitting for a high batting average because they are constantly scorching the ball. However, that is not the case because of all the strikeouts that pull the average down. You should not ignore that.
Secondly, walks are of some importance here as well. Joey Gallo was sixth in average exit velocity in 2019, but was also one of the league leaders in strikeout percentage (38.4%) and walk percentage (17.5%). Given his really high average exit velocity, you would surmise that he is going to hit a ton of home runs. You would be right about that, but the fact that 56% of his plate appearances end in a walk or a strikeout really takes away a lot of opportunity for homers. If you project him for 500 plate appearances in 2020 and say he will hit a home run in 20% of them, that is a 100 home run pace. However, when you factor in the fact that he will either walk or strikeout about half the time, that cuts the home run projection in half as well – that is a big factor to consider.
Thirdly, you should consider the launch angle when looking at exit velocity as well. A ball hit at 100 miles per hour at a 40-degree angle will probably find a fence to go over, but the same 100 miles per hour ball hit at an 80-degree angle is probably going to be a flyout.
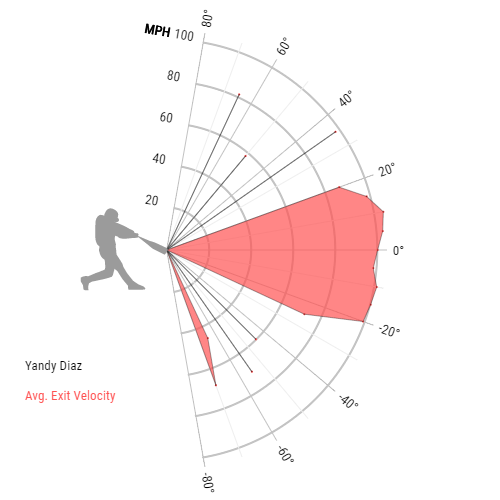
During the season, Baseball Savant puts out really useful visuals for each player showing their exit velocities and launch angles:

This visual shows each batted ball’s angle and velocity in one picture, which you can derive much more insight from than just looking at the averages. These are great visuals to reference when evaluating a player.
Every season that passes with this new data available makes more and more fantasy players aware of it. Chances are you are not the only one in your league that is using these advanced metrics, but there is still an advantage to be had if you can be the player that understands how to use the metrics most effectively.
Prepare for your fantasy baseball draft with our Mock Draft Simulator ![]()
Jon Anderson is a featured writer at FantasyPros. For more from Jon, check out his archive and follow him@JonPgh.


